A third of it is gone, or nine tenths
Three fluorescent labels in one piece of mouse tumour, fading across forty-seven frames. How much the vessels lost depends on whether you subtract the background first, and only one of the two answers is about the dye.
Somebody recording a tumour under a two-photon microscope has a decision to make at the end, and it is not the one about which frame to publish. It is what to say about everything that happened to the picture while they were recording it.
This file holds 47 frames of mouse tumour, each 21 optical sections deep, in three colours at once. Over those frames the picture empties out. The question this page is about is how much, and it has two defensible answers that are a long way apart.
One scale, all the way through


-
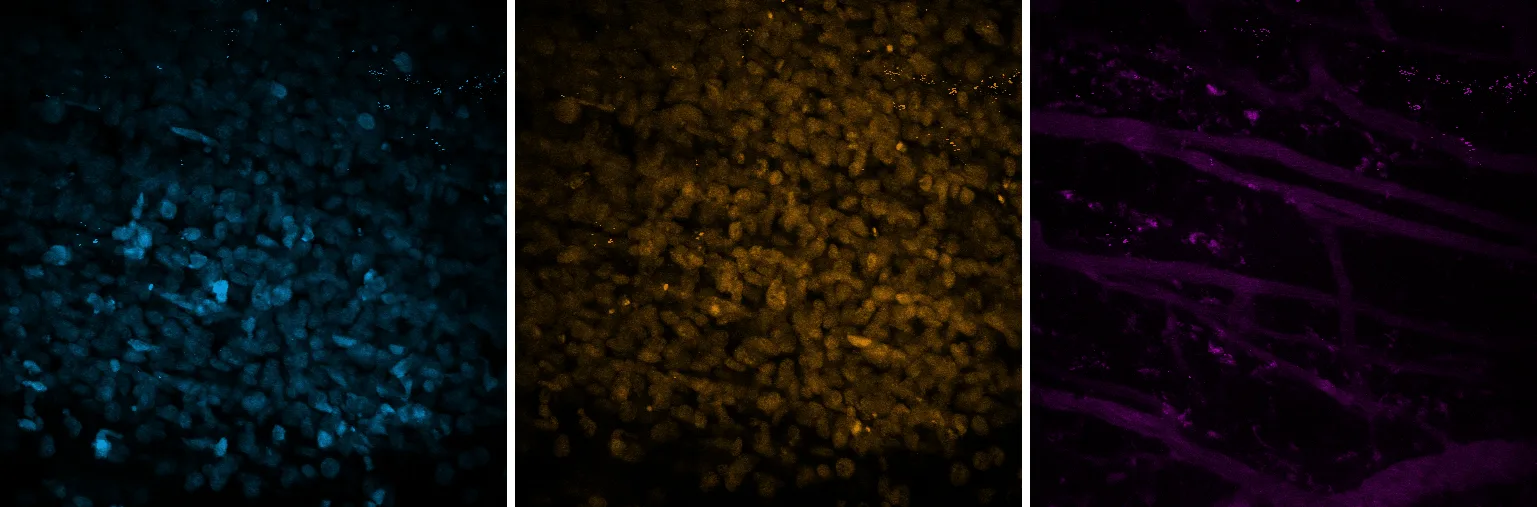
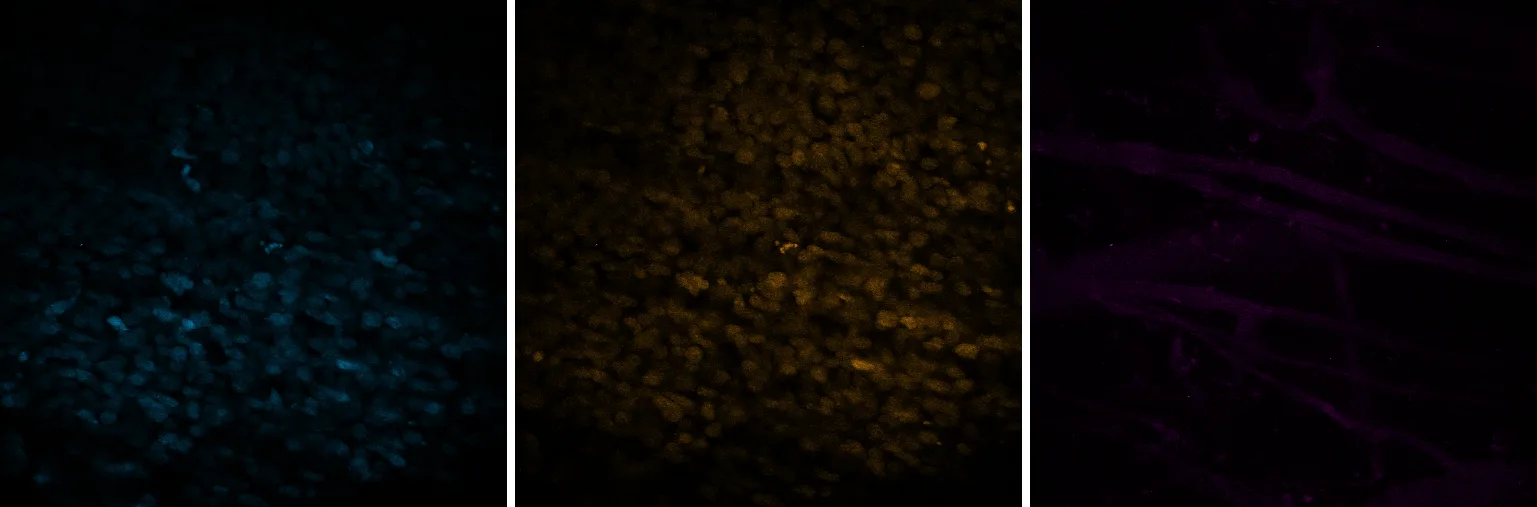
The first frame, and the scale every frame after it is drawn on. Three labels in one piece of mouse tumour: the transferred T cells on the left, the tumour cell nuclei in the middle, the blood vessels running through both on the right.
Frame 0 of 46.
-
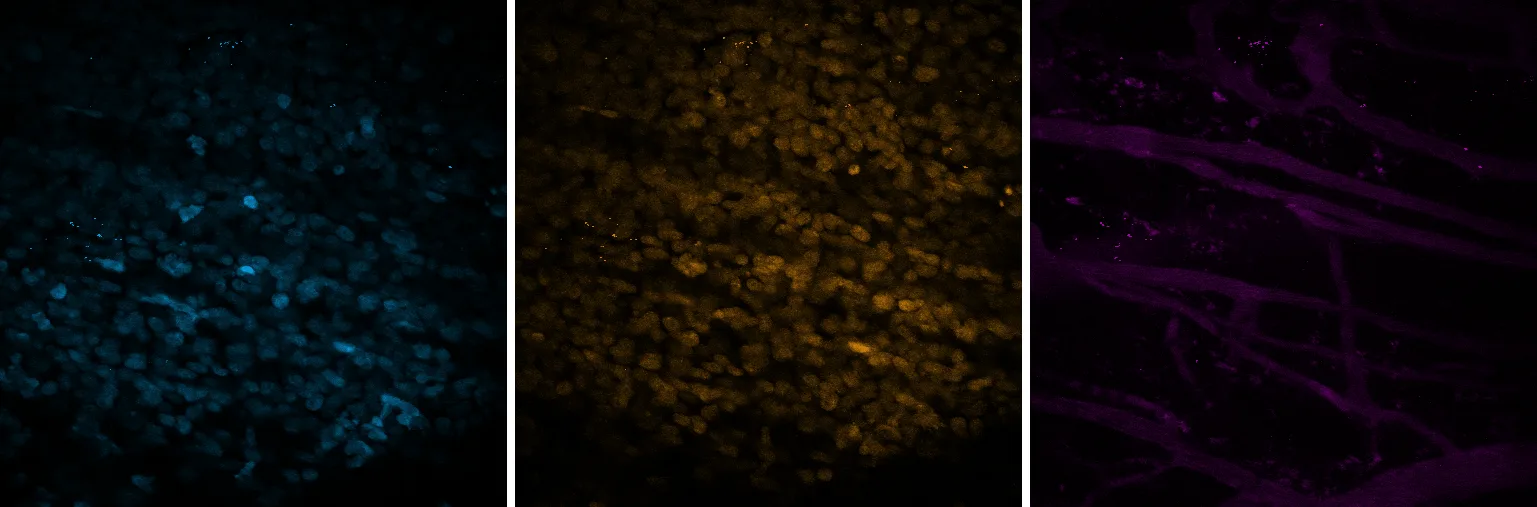
Eight frames in. Very little has changed, which is worth showing: the display is doing nothing yet.
Frame 8 of 46.
-
Sixteen. The T cell panel is down to 60% of its signal while the vessels hold 76%.
Frame 16 of 46.
-
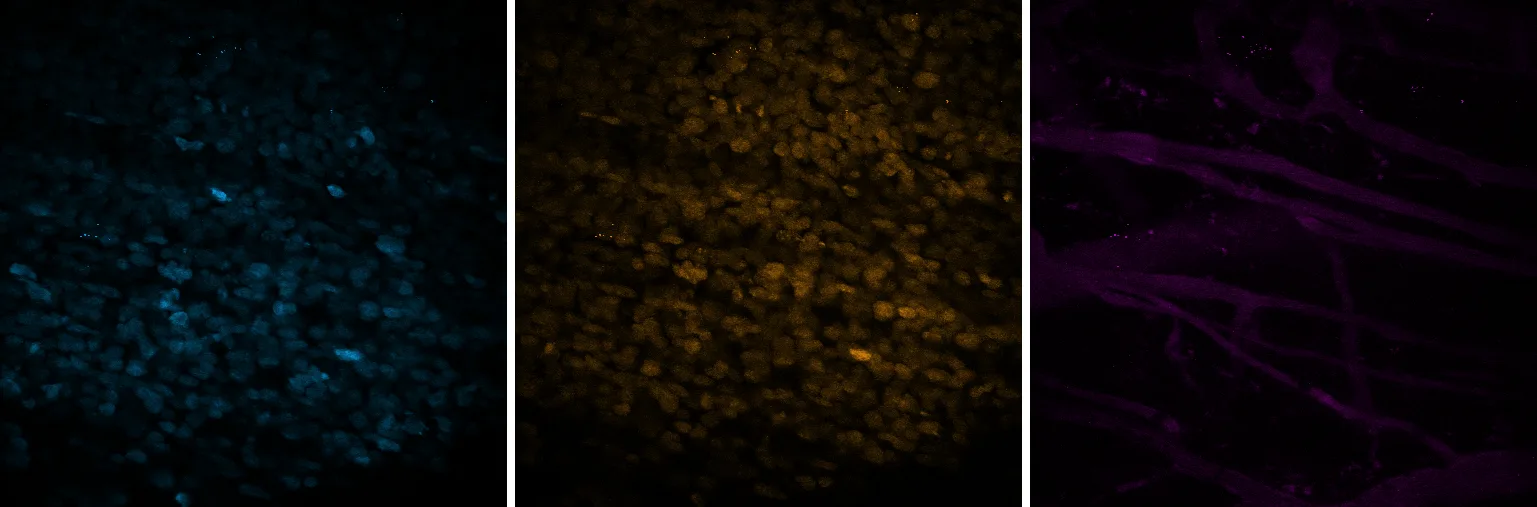
Twenty-four. All three are declining now, and at not very different speeds.
Frame 24 of 46.
-
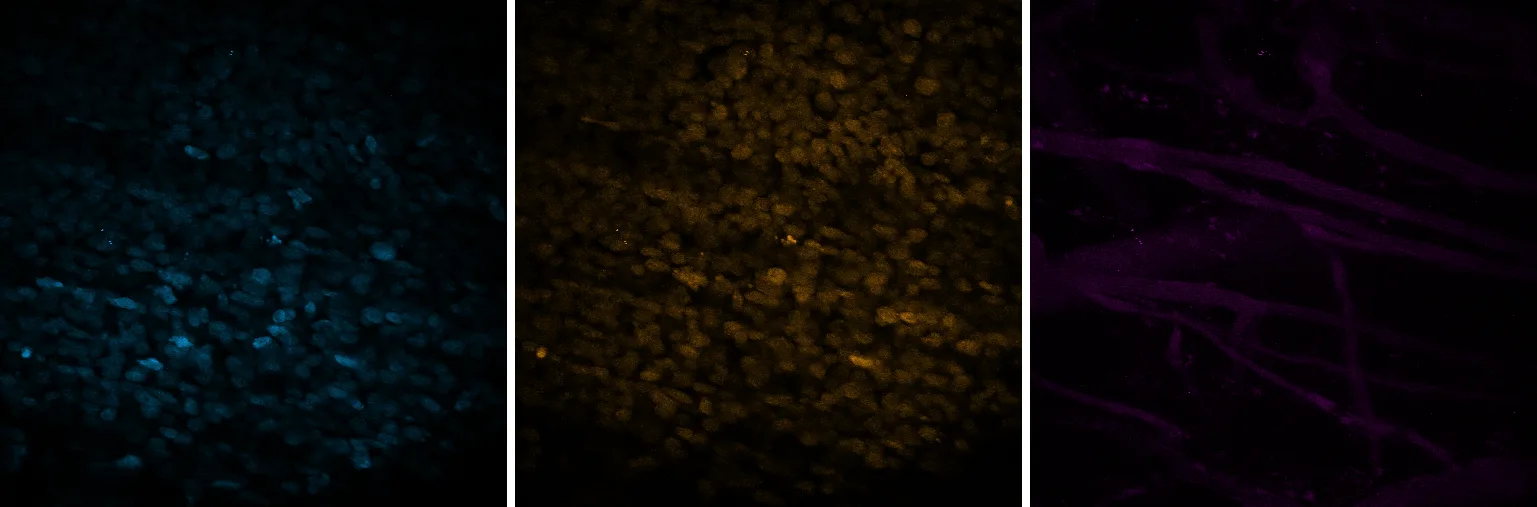
Thirty-two. Still about half of each. Nothing so far looks like a cliff.
Frame 32 of 46.
-
Forty. Here is the cliff. Every channel has dropped to under a quarter, together, in eight frames.
Frame 40 of 46.
-
The last frame. 1% of the T cell signal is left, 4% of the tumour nuclei, 9% of the vessels.
Frame 46 of 46.
Seven of the forty-seven frames, on one scale
Left to right in every frame: T cells, tumour nuclei, vessels. Each channel is drawn on a single scale taken from its own first frame and held for the whole series, so what changes here is the signal rather than a display setting. The three colours are this site's, not the file's, whose stored colours disagree with its own channel names.
Almost everything goes, and it mostly goes at the end rather than steadily. That much the pictures settle. Putting a number on it is where it gets interesting.
Two numbers for the same pixels
The same three channels, measured two ways
On the left, each channel's 99th percentile as a fraction of its own first frame. On the right, the same percentile with that frame's own median subtracted first, the median of a max projection of this tissue being background. Same pixels, same frames, one subtraction between them. The two panels share a y axis, which is the only reason they can be compared at all.
| Channel | as recorded | above background | Baseline at frame 0 |
|---|---|---|---|
| T cells | 18% | 1% | 1589 |
| tumour nuclei | 29% | 4% | 2399 |
| vessels | 69% | 9% | 342 |
Read as recorded, the vessels lost 31% and the T cells 82%, and the obvious conclusion is that these labels behave very differently. Subtract the background first and the vessels lost 91% and the T cells 99%, and the obvious conclusion is that they behave much the same.
The left panel is not wrong about anything. It is a true statement about the numbers in the file. It is simply not a statement about the dye, because every pixel in a channel carries that channel’s baseline whether or not anything is glowing, and the vessel channel’s baseline is most of what it has. Its 99th percentile at the first frame is only about 144 above its own median. A collapse of the signal cannot move a ratio built on that by very much, so it does not, and the number comes out reassuring.
This site measured it the first way and nearly published the reassuring version. What caught it was not a review of the arithmetic. It was putting the vessel row next to the claim in a poster and seeing a strip of black squares under the words “31 per cent gone”.
The other way the same frames can mislead you
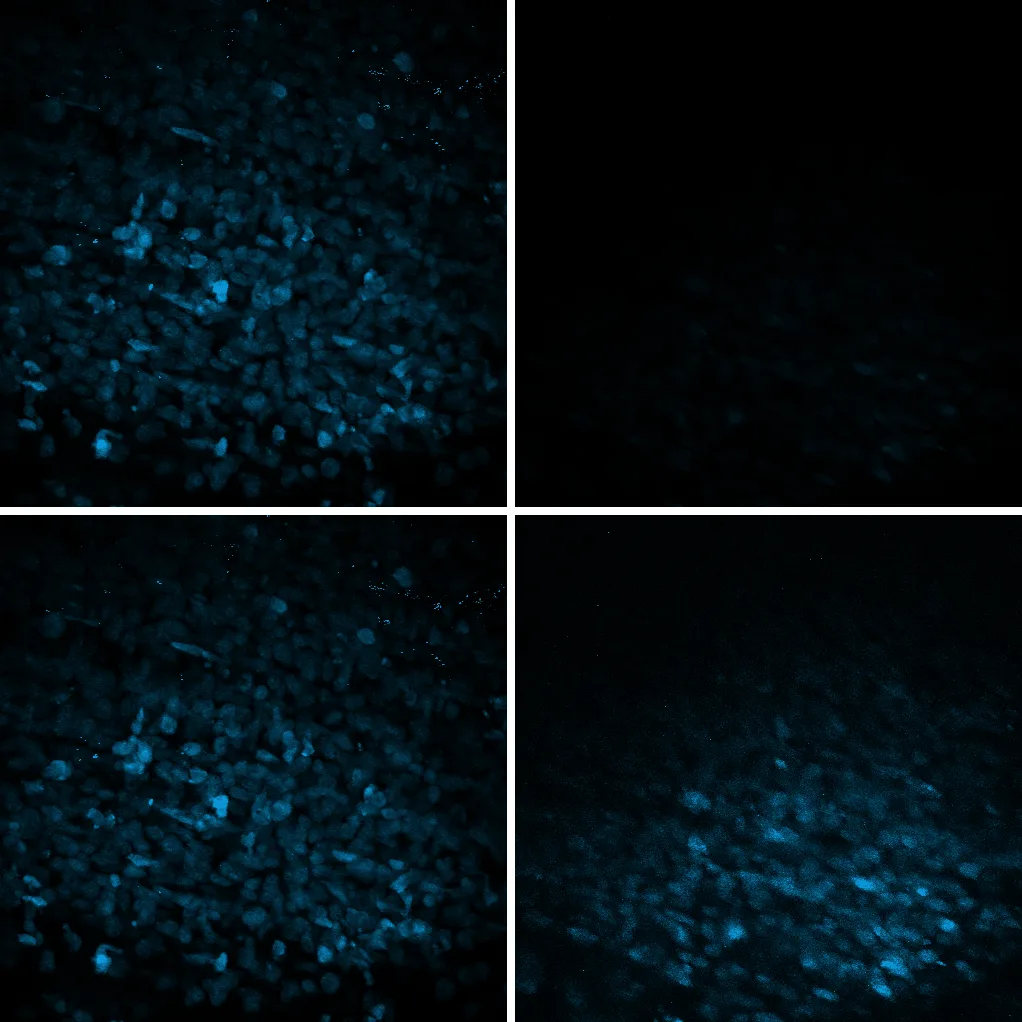
The T cell channel at frame 0 and frame 40
Top row: both frames on the scale set by the first, which is what every figure above uses. Bottom row: each frame scaled to its own range, which is the default in most software. The pixels are identical between the rows. Only the mapping from value to brightness differs.
The bottom right panel is built from pixels holding a small fraction of the signal of the panel above it, and it does not look like it. Autoscaling is not a trick and nobody switches it on in order to mislead. It is the default, it is usually what you want while you are hunting for something, and it removes the one property that would have let a reader compare two frames.
So there are two subtractions in this piece, and they are the same mistake in different clothes. Scaling each frame to itself takes away the comparison between frames. Not taking the baseline off takes away the comparison between channels. Both leave a number or a picture that looks fine.
What this is not an argument for
Not against the recording, which does something no single exposure can, and which was deposited whole so that this page could be written by somebody who has never held a two-photon microscope.
Not against these authors. Their figures are not reproduced here and are not the subject. This is one image from the control arm of their experiment, the annotation recording it as cytotoxic T lymphocytes only, and nothing here speaks to the question their paper was asking.
What is not measured: why it fades. Bleaching is the obvious guess and not the only one. The vessel label is a dextran injected into the bloodstream, which leaves it over time, while the other two labels are carried by the cells themselves. Three curves may be falling for three reasons, and the sharp drop near the end arrives in all three at once, which is the sort of thing that happens to a preparation rather than to a fluorophore. Which of those it was is a question for whoever ran the experiment.
And what the file does not say: how long. The deposit records no interval between frames and no pixel size. Everything here is counted in frames, and no figure on this page carries a scale bar.